
An audiogram is a graph that plots your hearing thresholds, the softest sounds you can detect, across different pitches, measured in a soundproof booth during a pure tone audiometry test. The chart uses a specific coordinate system where frequency runs horizontally and intensity runs vertically, with symbols marking your left and right ear responses separately. If you’ve just had a hearing test and been handed a printout covered in Xs, Os, and angled brackets, this guide will show you exactly what your results mean and why the pattern matters more than any single point.
Why Your Audiogram Looks Upside Down
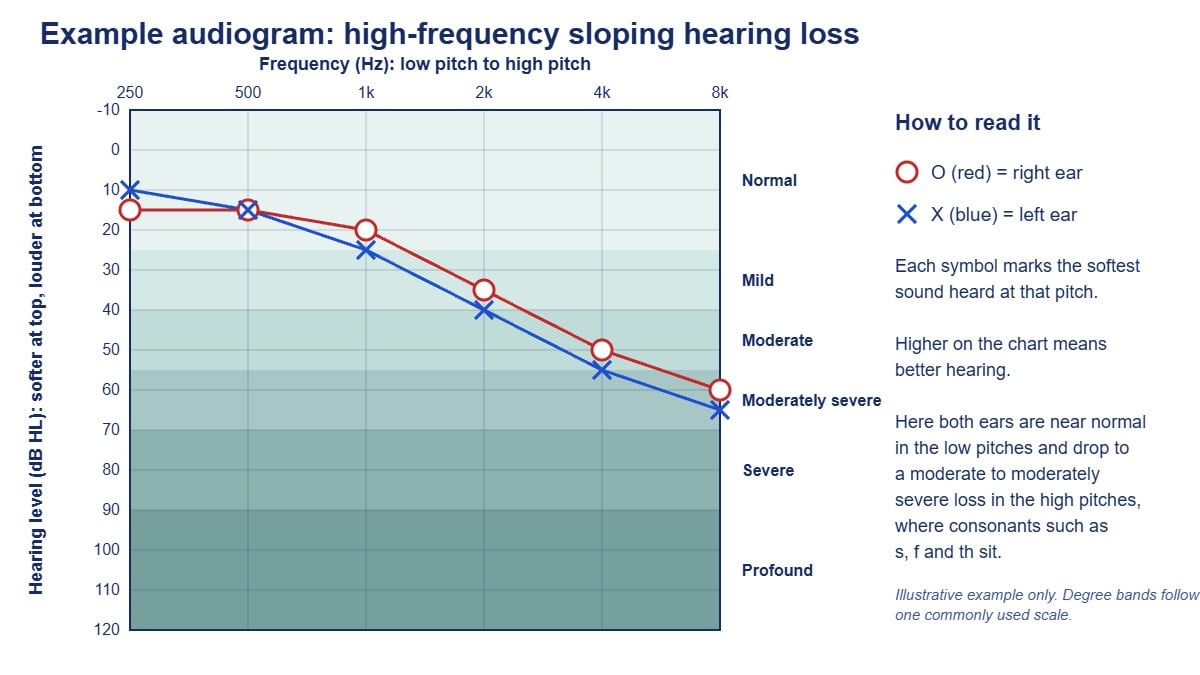
The first thing that confuses people is that zero sits at the top of the chart, not the bottom. In audiology, zero decibels Hearing Level (dB HL) doesn’t mean silence: it represents the softest sound a person with clinically normal hearing can detect at each frequency. As you move down the vertical axis, the numbers increase (10, 20, 30, 40 dB and beyond), indicating that louder sounds are needed before you can hear them. This inverted layout means that better hearing appears higher on the graph, and poorer hearing drops toward the bottom.
The horizontal axis shows frequency in Hertz (Hz), running from low-pitch sounds on the left (typically 250 Hz) to high-pitch sounds on the right (usually extending to 8000 Hz). The standard audiogram covers the range most critical for speech understanding, though extended high-frequency testing can go beyond 8000 Hz when investigating early noise damage or monitoring ototoxic medication.
The Symbols That Tell Your Story
Audiogram symbols follow published conventions (for example from the American Speech-Language-Hearing Association and the British Society of Audiology), so a qualified audiologist can read your results regardless of where you were tested. Many audiograms also use colour: red for the right ear and blue for the left.
Right ear air conduction is marked with a red O. Left ear air conduction uses a blue X. These symbols show how sound travels through your entire auditory system: outer ear, middle ear, cochlea, and auditory nerve. When we test air conduction, we’re presenting sounds through headphones or insert earphones and asking you to respond when you barely hear them.
Bone conduction uses angle brackets: < for the right ear and > for the left ear. When the other ear has been masked with noise during testing, you may see square brackets ([ right, ] left) for bone conduction, and a triangle (right) or square (left) for air conduction. For these measurements, we place a small vibrator on the mastoid bone behind your ear, which bypasses the outer and middle ear entirely and stimulates the cochlea directly. The relationship between your air and bone conduction thresholds is diagnostically crucial: it tells us whether hearing loss originates in the mechanical sound-conducting system (outer and middle ear) or in the sensory system (cochlea and beyond).
When air and bone conduction thresholds sit close together, within about 10 dB of each other, we call this a sensorineural hearing loss: the inner ear or auditory nerve isn’t functioning optimally. When there’s a significant gap, with bone conduction notably better than air conduction, that gap is called an air-bone gap and indicates conductive hearing loss: something is preventing sound from efficiently reaching the inner ear. Mixed hearing loss shows both patterns combined.
What “Normal” Actually Means
Hearing thresholds between -10 and 25 dB HL across all frequencies are generally considered within normal limits for adults (some scales use 20 dB as the cut-off). You’ll sometimes see this shaded on audiogram forms as a reference zone. But normal doesn’t mean perfect, and it doesn’t mean unchanged from your personal baseline.
A 22-year-old with thresholds at 20 dB has technically normal hearing, but if those same thresholds were 0 dB two years ago after significant noise exposure, that 20 dB shift represents real damage even though it’s still “within normal limits.” This is why I keep baseline audiograms on file for patients in noisy occupations or those taking potentially ototoxic medications: we’re watching for change, not just categorical placement.
One widely used scale breaks down the degrees of hearing loss as:
- Mild: 26 to 40 dB HL
- Moderate: 41 to 55 dB HL
- Moderately severe: 56 to 70 dB HL
- Severe: 71 to 90 dB HL
- Profound: 91 dB HL or more
These classifications help with rehabilitation planning, but the functional impact depends heavily on which frequencies are affected and the pattern of loss.
Audiogram Patterns and What They Mean in Real Life
The High-Frequency Sloping Loss
This is the most common pattern we see, especially in age-related hearing loss (presbycusis) and noise-induced hearing loss. Thresholds in the low frequencies (250 to 500 Hz) sit in or near the normal range, then progressively worsen as frequency increases, often dropping steeply beyond 2000 Hz.
People with this configuration typically say they can hear that someone’s talking but can’t understand what’s being said, especially in background noise. That’s because vowel sounds carry most of their energy in lower frequencies (where hearing is often still adequate), while consonants, the sounds that distinguish “cat” from “hat” or “sun” from “fun”, live in the higher frequencies. Women’s and children’s voices become particularly difficult because their fundamental frequencies sit higher than men’s voices.
If you overlay the “speech banana” on an audiogram (a shaded region showing where conversational speech sounds fall in terms of frequency and intensity), a high-frequency sloping loss means many critical speech sounds fall below your threshold. Hearing aids for this pattern focus amplification in the high frequencies while leaving low frequencies relatively untouched.
The Flat Loss
A flat configuration shows roughly equal hearing loss across all frequencies. Speech may sound consistently quieter but generally remains clear, assuming the loss is mild to moderate. These patients often do well with appropriately fitted amplification because we’re essentially turning up the volume across the board without the complex frequency-specific shaping required for sloping losses.
Flat losses can be conductive (such as with otosclerosis or chronic middle ear disease), sensorineural, or mixed. The air-bone relationship tells us which.
The Cookie-Bite or Mid-Frequency Loss
This U-shaped pattern shows better hearing in the low and high frequencies with a dip in the mid-frequencies, typically around 1000 to 2000 Hz. It’s less common than sloping loss and is often hereditary.
Functionally, cookie-bite losses can be surprisingly disruptive despite sometimes appearing mild on paper, because those mid-frequencies carry crucial speech information. Patients describe speech as “muddy” or complain they do poorly in groups even when one-on-one conversation seems manageable. Amplification for this pattern requires careful management: over-amplifying the already-normal lows and highs creates loudness discomfort, while under-treating the midrange dip leaves clarity problems unsolved.
The Noise Notch
A noise notch (or acoustic trauma notch) appears as a sharp dip at 3000, 4000, or 6000 Hz, with some recovery in the frequencies on either side. It’s the signature of noise exposure, whether occupational, recreational (concerts, shooting sports, power tools), or from a single acoustic trauma.
When I see a clear 4000 Hz notch in someone’s twenties or thirties, I have a different conversation than when I see broad high-frequency loss. The notch indicates specific preventable damage, and it’s a warning sign. Noise-induced hearing loss typically starts around 3000 to 6000 Hz and spreads to neighbouring frequencies with continued exposure. Early action (proper hearing protection, noise monitoring, workplace changes) can stop a notch from becoming a broader loss that needs amplification.
The Speech Banana and Functional Hearing
The speech banana overlay I mentioned earlier plots where different phonemes (speech sounds) fall on the audiogram. For example:
- The “m” sound sits around 250 Hz at about 30 dB
- Vowels cluster in lower frequencies at moderate intensities
- “s,” “f” and “th” sounds appear in the higher frequencies (roughly 3000 to 8000 Hz) at soft intensities
When your hearing thresholds drop below these speech sounds, those phonemes become inaudible in normal conversation. This is why two people with a “moderate hearing loss” can have vastly different functional abilities: one might have 50 dB thresholds at 250 and 500 Hz (missing low-frequency speech), while another has 50 dB thresholds at 3000 and 4000 Hz (missing high-frequency consonants). The latter will struggle far more in everyday communication.
What Your Audiogram Can and Cannot Tell You
A standard pure tone audiogram is essential but limited. It tells us the softest sounds you can detect at discrete frequencies in a quiet environment. It doesn’t directly assess:
- Speech understanding in noise (we use speech-in-noise testing for this)
- Processing speed or auditory processing ability (assessed separately with specialised testing)
- Middle ear function (requires tympanometry)
- Site of lesion (comprehensive diagnostic protocols may include otoacoustic emissions, acoustic reflex testing, or auditory brainstem response)
- Real-world amplification needs (assessed during hearing aid trials with real-ear measurement)
This is why our adult diagnostic hearing assessments run for 90 minutes. The audiogram anchors the assessment, but it’s one piece of the clinical picture.
Making Sense of Your Results
If you’ve been handed an audiogram without adequate explanation, here’s what to look for:
- Where do your symbols sit relative to the 25 dB line? Anything below that line indicates hearing outside normal limits at that frequency.
- What’s the pattern: does loss worsen in the highs, lows, or middle? Pattern predicts both cause and functional impact.
- Is there an air-bone gap? A gap suggests a conductive component that might be medically treatable. If thresholds are outside normal limits with no gap, the loss is sensorineural.
- Is the loss symmetrical or asymmetrical? Asymmetrical losses (one ear notably worse than the other) sometimes warrant medical imaging or additional investigation to rule out problems such as an acoustic neuroma.
- Where does your loss intersect with the speech banana? This shows which sounds you’re missing in conversation.
You’re entitled to a copy of your audiogram, an explanation of what it means, and a clear management plan. At The Audiology Place, we walk through results at the appointment and keep records so we can monitor change over time. If you were handed a printout and moved straight to a sales conversation, it’s reasonable to ask for a proper explanation first.
What Happens Next
Your audiogram helps determine whether medical referral is needed before considering hearing aids and, if you’re eligible for the Australian Government Hearing Services Program (for example as a Pensioner Concession Card holder or eligible DVA card holder), whether you meet the hearing criteria for subsidised devices. People under 26 receive government-funded hearing services through Hearing Australia.
For many patterns, particularly conductive losses, sudden asymmetrical losses, or losses accompanied by tinnitus, ear pain, or drainage, we recommend medical review (usually through your GP, who can refer you to an ENT specialist) before discussing devices. A sudden drop in hearing needs medical assessment the same day or the next day. Sensorineural losses benefit from amplification, but the specific technology, fitting formula, and verification protocol depends entirely on your audiogram configuration and your daily listening environments.
Understanding your audiogram isn’t about becoming your own audiologist: it’s about being an informed participant in your hearing healthcare. The graph is a diagnostic tool, and like any medical test result, it deserves proper interpretation and a management plan that addresses your individual pattern, not a one-size-fits-all solution.
If you’d like your audiogram reviewed or need comprehensive diagnostic testing, our team at The Audiology Place provides full audiological assessment with same-day results discussion and transparent next steps, whether that’s monitoring, medical referral, or exploring rehabilitation options.