
People with high-frequency hearing loss often describe speech the same way. They can hear that someone is talking, but the words are blurred, as if everyone has started mumbling. The explanation lies in the acoustics of speech. Vowels and consonants occupy different parts of the frequency range, carry very different amounts of energy and contribute unequally to meaning. Once you see where each sound sits, an audiogram starts to read like a map of what a person is missing.
Vowels are shaped by resonance
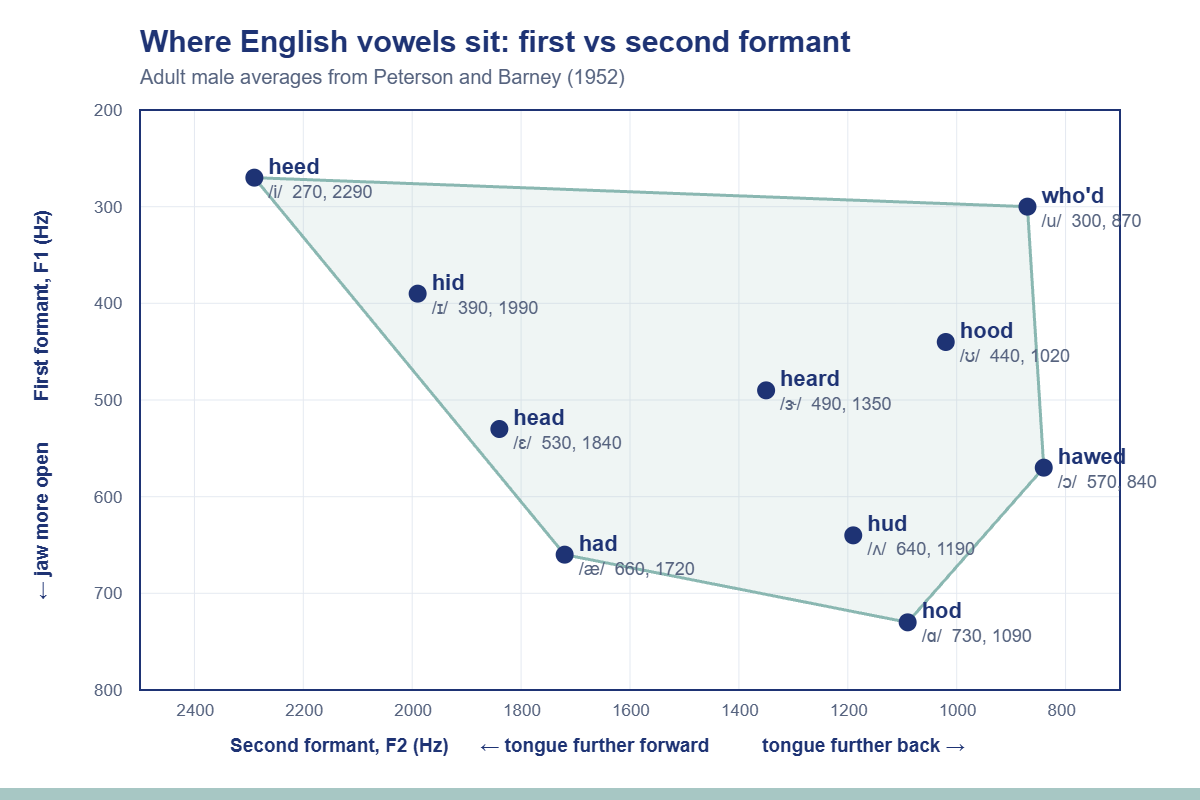
When you speak, your vocal folds produce a buzz with a fundamental frequency of roughly 100 to 120 Hz for an adult man, around 200 Hz for an adult woman and higher again for children, along with a long series of harmonics. The throat, mouth and lips then act as a set of filters. Moving the tongue and jaw changes the shape of that tube, and the tube resonates at particular frequencies called formants. The first two formants, F1 and F2, are enough to identify most vowels.
F1 rises as the jaw opens and the tongue lowers. F2 rises as the tongue moves forward in the mouth. In the classic 1952 measurements by Gordon Peterson and Harold Barney, the vowel in “heed” had an F1 of about 270 Hz and an F2 of about 2,290 Hz for men, while the vowel in “hod” had an F1 of about 730 Hz and an F2 of about 1,090 Hz. Plot F1 against F2 for all the vowels and you get a rough quadrilateral that mirrors the position of the tongue.
The same vowel spoken by a child and by a man has different absolute formant frequencies, because a child’s vocal tract is shorter. Listeners cope by judging formants relative to the speaker’s other vowels and voice pitch, a process called vowel normalisation. It is one reason a familiar voice is easier to follow than a stranger’s, with or without hearing aids.
Consonants are brief, quiet and often high-pitched
Vowels are the loud part of speech. The strongest vowels are roughly 25 to 30 dB more intense than the weakest consonants, such as the “th” in “thin”. Consonants are also short, many under 100 milliseconds, and a lot of them depend on high-frequency energy.
- Fricatives such as “s”, “sh”, “f” and “th” are turbulent noise. “Sh” has most of its energy from about 2,000 to 6,000 Hz. “S” sits higher, mostly between about 4,000 and 8,000 Hz, and in women’s and children’s voices it can peak near 9,000 Hz.
- Stops such as “p”, “t” and “k” are a brief silence followed by a burst. Their identity is carried partly by the burst and partly by the quick formant movements into the next vowel.
- Nasals such as “m” and “n” have strong low-frequency energy and are easier to detect, but harder to tell apart from each other.
Those formant movements matter as much as the sounds themselves. When your mouth moves from a “b” or a “d” into a vowel, the second formant glides up or down over about 40 to 50 milliseconds, and the brain reads the direction of the glide as the place the consonant was made. The glides sit in the mid to high frequencies and are among the first cues to blur with cochlear hearing loss, which also widens the ear’s frequency filters and smears fine spectral detail.
Ship, sip and chip
Take three words that differ only in their first sound. “Ship” starts with a broad band of noise centred in the 2,000 to 6,000 Hz range. “Sip” starts with a higher, narrower hiss. “Chip” starts with a short silence and a burst, followed by a “sh”-like noise. The vowel and the final “p” are almost identical in all three.
Someone whose hearing falls away above 2,000 to 3,000 Hz hears the vowel clearly and gets the rhythm of the word. The first sound, the part that changes the meaning, arrives weak or not at all, and the final “p” may vanish. With context, the listener can often guess. In background noise, or when the topic changes suddenly, the guess is wrong often enough to make conversation tiring.
The speech banana and what it leaves out
On an audiogram, the “speech banana” is the shaded region where the sounds of conversational speech at a normal distance fall. Low-pitched vowel energy sits to the left at moderate levels, and soft high-pitched consonants such as “f”, “s” and “th” sit to the upper right at faint levels. If your thresholds fall below part of the banana, the sounds in that region are inaudible, at least when the talker is a metre or so away in quiet. Our guide to reading an audiogram explains the axes and symbols.
The banana gives every part of speech equal standing, but some frequencies matter far more for understanding than others. The Speech Intelligibility Index, set out in the American standard ANSI S3.5-1997, gives each frequency band a weighting based on how much it contributes to understanding. For average speech the bands from roughly 1,000 to 4,000 Hz carry the most weight. The low frequencies that hold most of the loudness contribute relatively little to intelligibility.
Gus Mueller and Mead Killion turned that idea into the “count-the-dots” audiogram in 1990 and revised it in 2010. It places 100 dots across the speech range, packed more densely where the weighting is higher. Count the dots above your thresholds and you have a rough percentage of the speech information that is audible to you. A person with a sloping high-frequency loss can lose a large share of the dots while their low-frequency hearing looks normal, which matches the usual complaint of plenty of volume and not enough clarity.
What this means for hearing aid fitting
Turning everything up does not fix a consonant problem. It makes vowels and background noise louder without necessarily making “s” audible. A good fitting targets the frequencies where audibility is missing and uses compression so that soft consonants are lifted more than loud vowels. Whether that has worked is checked with real-ear measurement: a probe microphone in the ear canal shows the actual sound level reaching the eardrum across frequencies. We explain why we use it in our commitment to real-ear measurement.
Bandwidth matters too. Many hearing aids provide useful gain only up to about 5,000 to 6,000 Hz. Research by Patricia Stelmachowicz and colleagues in the early 2000s found that children with hearing loss had particular trouble perceiving “s” spoken by women and children, because so much of its energy sits above that limit. For listeners with severe high-frequency loss, frequency-lowering features can move those cues down to a region where the ear still responds. Whether that helps depends on the person, which is another reason to verify instead of assuming. Our article on cochlear dead regions covers one of the factors in that decision.
Finally, the audiogram is measured with single tones in a quiet booth and doesn’t show how well you separate speech from competing noise. Speech-in-noise testing fills that gap and often explains why two people with similar audiograms describe very different everyday difficulty.